pfSense log parsing in Graylog (including suricata/snort)
This guide is the second part in a series which looks at setting up a grafana dashboard for your pfSense network, the first part should be completed before following these steps.
1. Setting up indices
Graylog stores log in a series of indices and we’ll be splitting out our logs into 3 main areas. The reason for this is twofold. First, Suricata/Snort and filterlog have different attributes from the rest of the logs when parsed. Second, Suricata/Snort and filterlog can generate a lot of data and you may wish to choose different retention strategies (beyond the scope of this guide).
For simplicity, we’ll use the Graylog UI to create these indices (there are other tools if you should so wish to use them). New indicies are setup from System / Overview > Indices and then using the Create index set button. For simplicity in this guide, use the default values, which should mean you’ll just need to enter the title, Description and Index prefix for each:

Hit Save and do the same for the other two indices pfSense / Suricata (pfsense_suricata) and pfSense (pfsense).
2. Setting up Service and GeoIP look ups
Next up we’ll configure the ability for Graylog to automatically convert port numbers to the service names and for any external IPs to do the Geo lookup (this allows you to plot events on a map).
2.1. Port Mappings
opc40772 has some additional pfSense/grafana content - whilst that isn’t specifically used in this tutorial it may provide some interesting background reading and also provides a CSV that can be used by the content pack for service lookups.
For the time being, just download the port mappings to your graylog server - from the command line and move it to where Graylog can easily access it:
wget https://raw.githubusercontent.com/opc40772/pfsense-graylog/master/service-names-port-numbers/service-names-port-numbers.csv
cp service-names-port-numbers.csv /etc/graylog/server
2.2 Geo IP look ups
Similar to the Port/Service lookup we’ll download and setup the Maxmind Geo IP database. You’ll need to register at the Maxmind website and get your license key from My Account > My License Key, then run the following from the command line (and replace with your license key):
wget https://download.maxmind.com/app/geoip_download?edition_id=GeoLite2-City&license_key=YOUR_LICENSE_KEY&suffix=tar.gz -O geo-city.tar.gz
mv GeoLite2-City_20200630/GeoLite2-City.mmdb /etc/graylog/server/GeoLite2-City.mmdb
Once you’ve compeleted the downloads, activate the Geo IP database in Graylog System > Configurations. At the bottom of the screen is the configuration for plugins - enabled the Geo-Location Processor:

3. Setting up the pfSense content pack
Now all the scaffolding is complete, the last piece of Graylog configuration is to import the c0ontent pack with the various pipelines to fill the indices we setup at the of this guide.
3.1. Download the content pack
Download the content pack and then visit System > Content Pack > Upload.
3.2 Set the order of processors
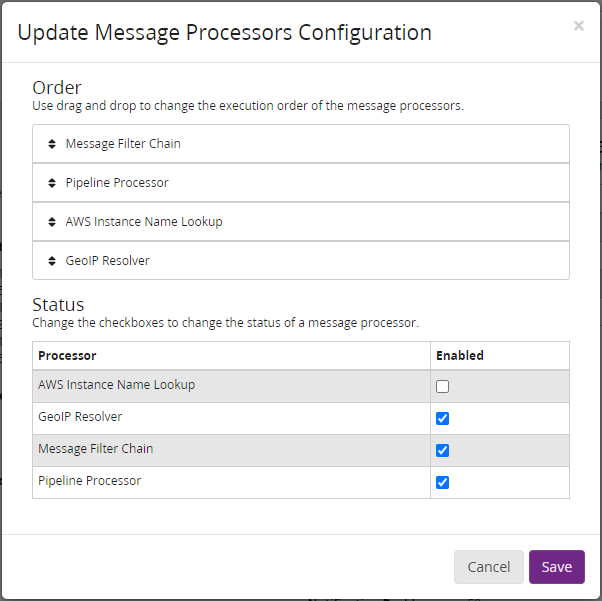
Graylog is specific about the order that processors run, these settings work for me and this guide and if you don’t set them this way you’ll find your pipelines don’t parse any messages so set them as follows unless you know what you’re doing. Under System > Configurations > Message Processors COnfiguration click the update button and make sure it is set to teh following order:

3.3 Configure the streams
The pipelines are the bit that perform the magic to parse the logs we shipped in the first part of the guide. Now the content pack is uploaded, the next step is to assign the pipelines to the correct streams and indices.
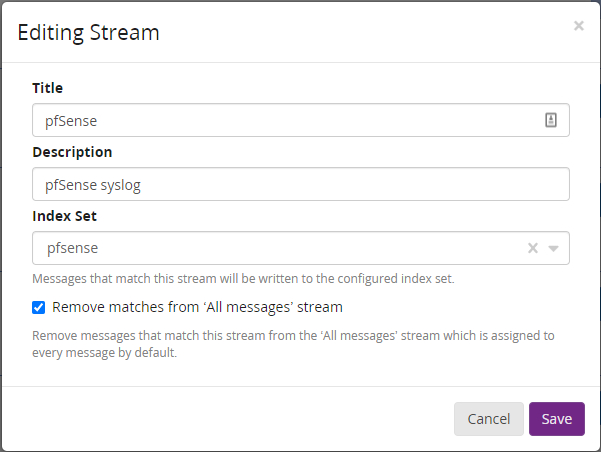
For each of the 3 pfSense streams, the process is the same. Edit the stream under Streams > pfSense > More Actions > Edit:

Then assign the new index stream (remove from the ‘All Messages’ is optional, but recommended), save and then activate the stream if needed:

Repeat this for each of the remaining pfSense streams.
4. Testing
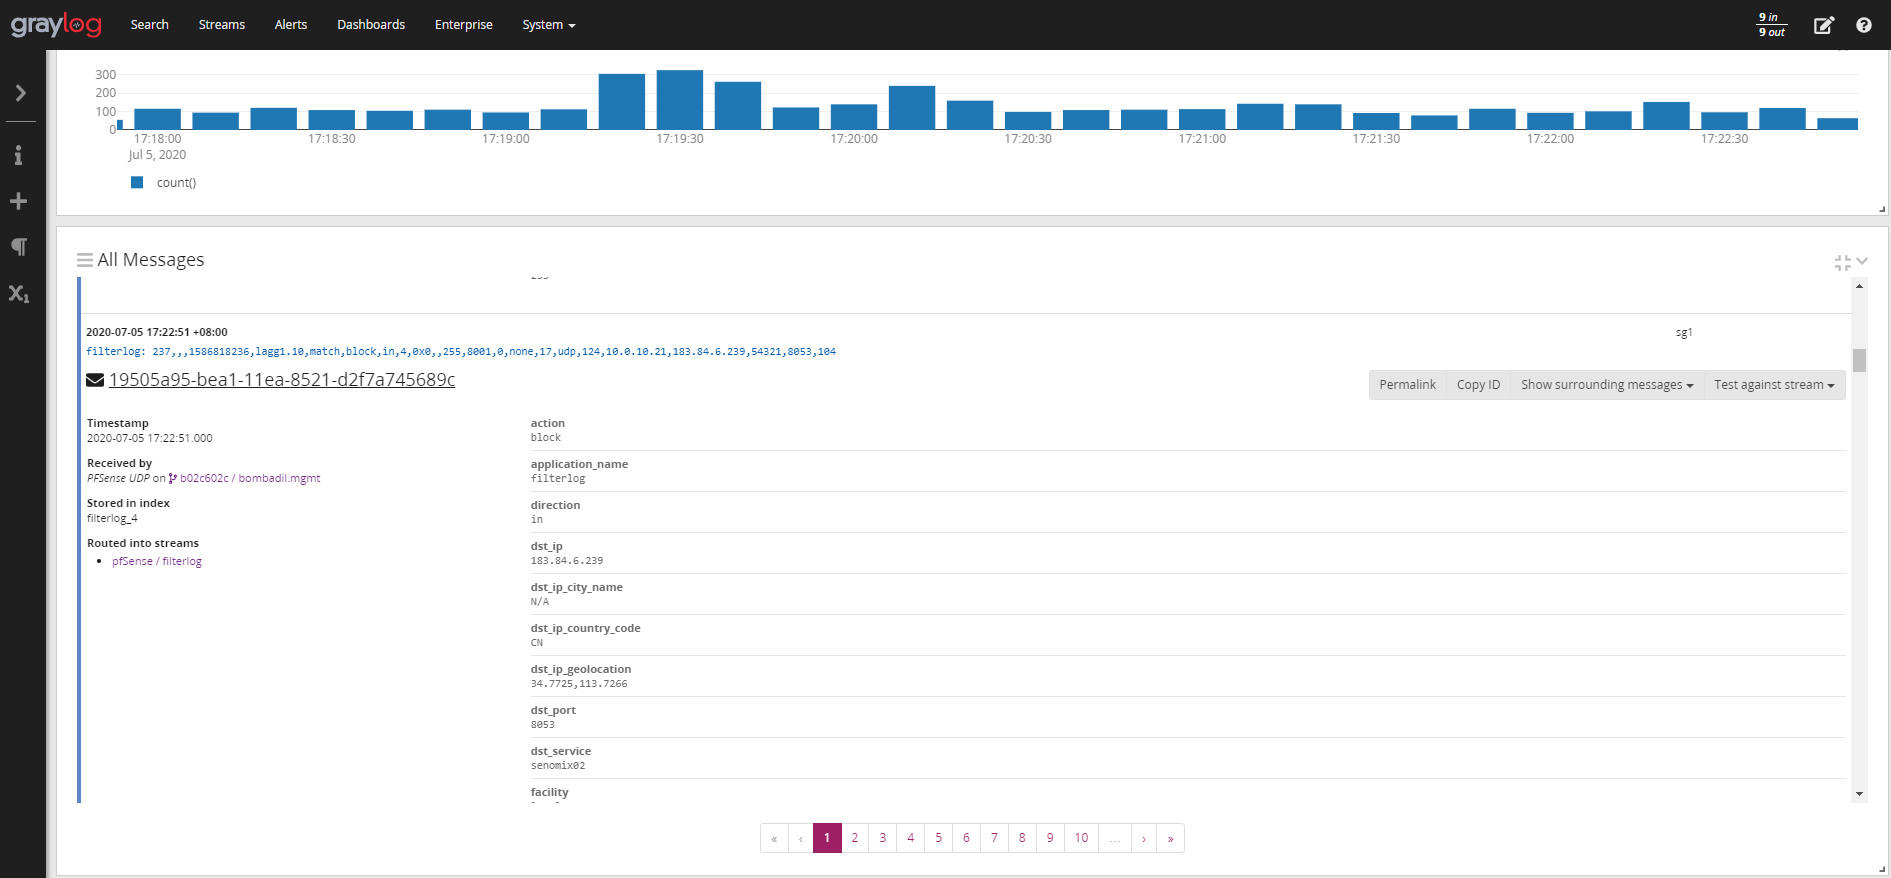
At this point you should now start to see logs from pfSense and Suricata/Snort parsed in your Graylog server. Click on the filterlog stream you have just configured and you should see messages flowing the the dst_ip_configuration_code and dst_service fields competed:


