

pfSense log consolidation to Graylog (including suricata/snort)
This guide is an overview of how to push logs from pfSense (an Open Source firewall) into Graylog (an Open Source log aggregated and parser).
It’s one of the foundational building blocks to building a Threat Intellegence toolset using Open Source software.
These instructions are one way of getting data from pfSense and Suricata (tested on pfSense 2.4.5) into Graylog (tested 3.2). They should also work for Snort given the same log formats.
1. Installing Graylog
Rather than reproduce extensively maintained installation instructions, you should be able to dollow the instructions from Graylog to get a basic installation up and running.
Once you have this, then follow on to the next step.
2. Setting Up Graylog
To make things easy, I keep a seperate UDP input for pfSense. This allows me to easily sperate pfSense’s logs as they are not in the standard format Graylog expects and to keep some simple extractors which then parses the correct application from the input and runs a couple of pipelines to further parse messages and store them in the approriate streams.
2a. Setup a new input
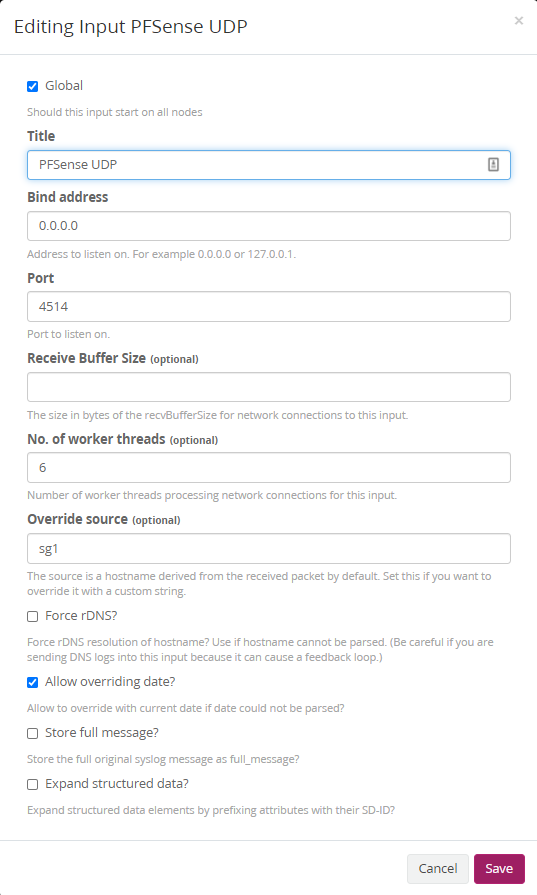
First up set up a new UDP stream to receive all pfSense logs. Visit System / Inputs > Inputs at the top select Syslog UDP and click Launch new input.
Fill out the values below and replace sg1 in Override source with the hostname you use for your pfSense firewall hostname
2b. Add an extractor to your new input
This step sets our first variable in Graylog we’ll use in Part 2 to build our streams and pipelines
- Visit Github to download
extractors.json - Visit
System / Inputs > InputsthenManage extractors(the blue button next the stream you have just setup) and thenActions > Import extractors. - Copy the text from
extractors.jsonand clickAdd extractors to input
3. Sending pfSense Logs
We’ll be sending both the default pfSense logs and the Suricata/Snort logs to Graylog. This is done in two parts.
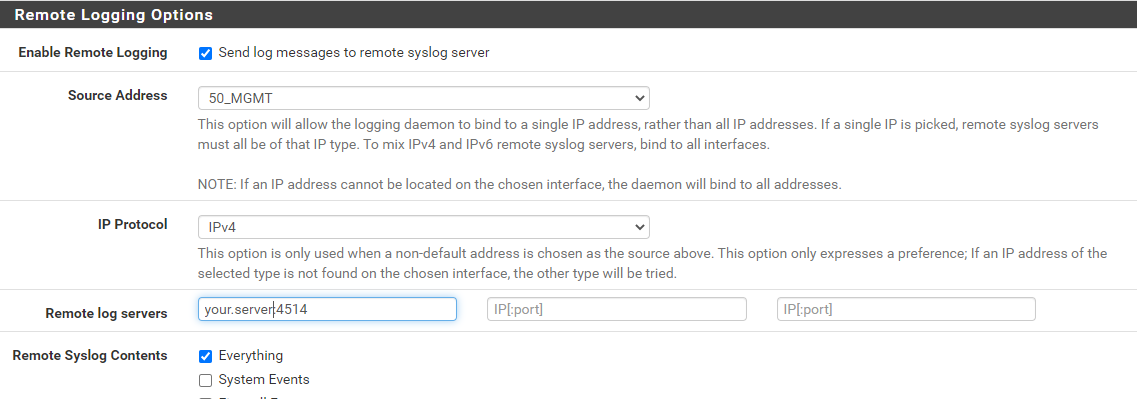
3a. pfSense Syslog Logs
First of all from your pfSense firewall visit Status > System Logs > Settings. From there send the logs to Graylog by replacing your.server:4514 with the hostname or IP address of your Graylog Server and leave :4514 unless you decided to digress from the instructions and used a different port. Then hit Save.
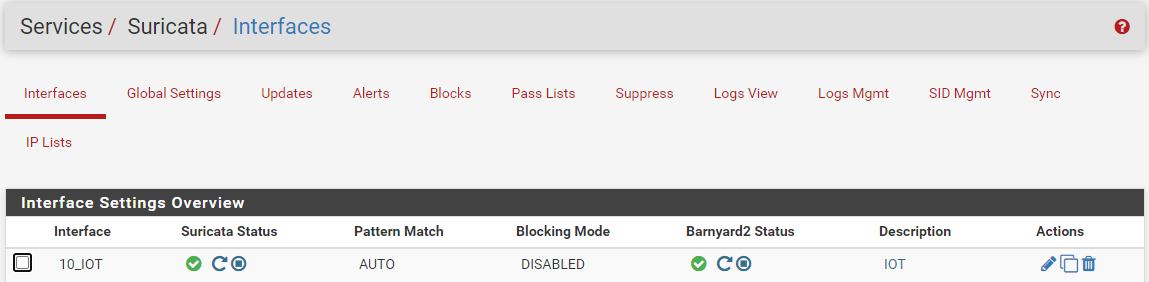
3b. Suricata/Snort Logs
Next, we’ll send Suricata or Snort logs. These instuctions assume you already have Suricata or Snort set up, check out the pfSense IDS / IDP insturctions if you haven’t. I’m using Suricata but the following should be similar for Snort. Visit Services > Suricata and click the edit icon next to the interface you wish to send logs for.
We’ll then use Barnyard2 to send the logs - these are sent straight to the graylog server input detail above. Using Barnyard2 has the added benefit that the start of the log includes the Suricata/Snort tag, rather than a random number stream if you just use local logging without Barnyard2. First of all make sure that Barnyard 2 is enabled at the top and then complete the following details:
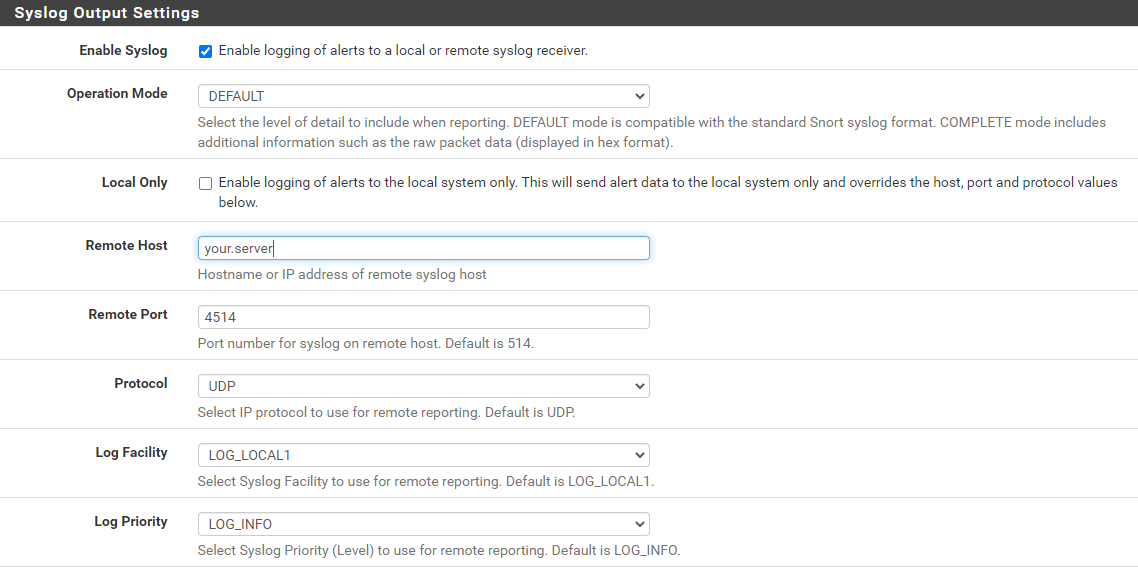
Click Save and then follow the instructions that tell you [re]start Barnyard 2
4. Testing
At this point you should now start to see logs from pfSense and Suricata/Snort in your Graylog server. Click on the ‘Search’ tab in Graylog to check - it’ll probably have a lot of filterlog entries if you’re logging firewall events.


